Scrape webpage tables and visualize interactive plot using plotly in R
 Image credit: unsplash
Welcome
TL;DR
Too Long; Don’t Read This post will demonstrate how to get data from a website using package:rvest and Python Beautiful Soup library. It will also reproduce a COVID-19 vaccine interactive plot using package:plotly.
Scrape webpage tables
Introdcution
In the Programming with Data course we will not cover web scraping but some data we use was actually scraped from websites. This post will show you how to do some simple web scraping and I hope it will motivate you to learn more.
R is very good at data visualizations with its wonderful package package:ggplot2. When I read a newspaper article with plots, I always want to reproduce it using R. Today I read the news at Financial Times and it shows the following plot. Note that SMU students have free access to Financial Times and many other leading newspapers and magazines.
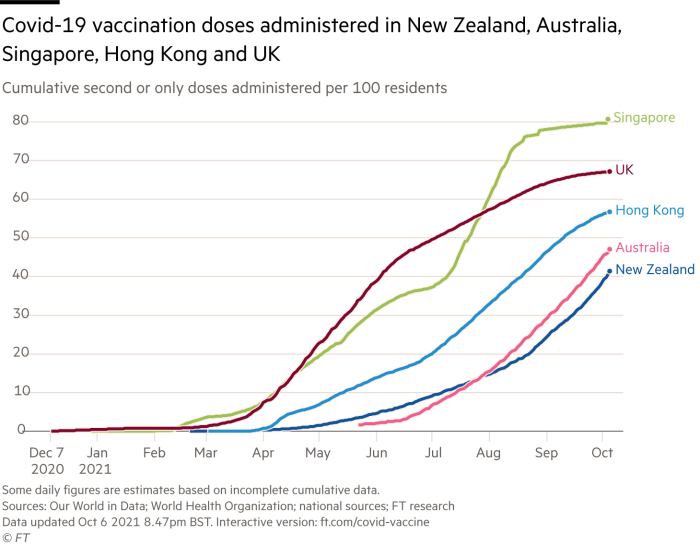
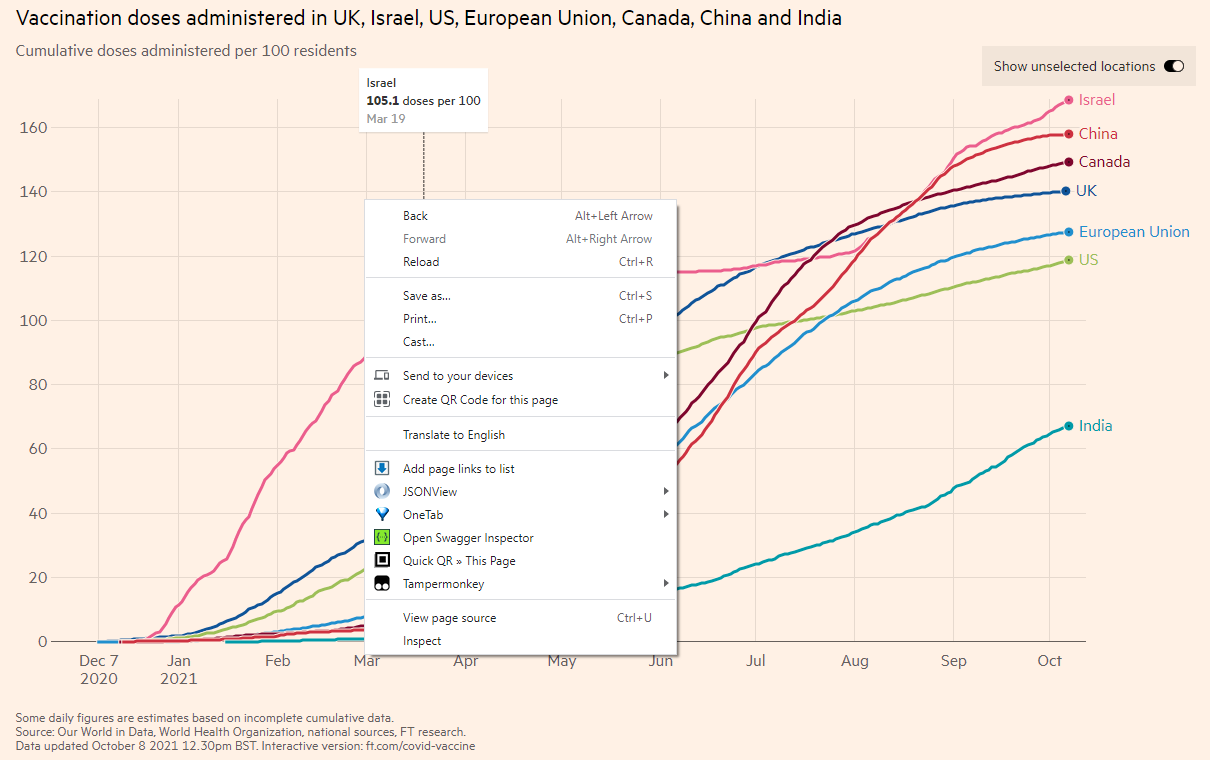
As the image is static and I cannot get the data for reproduction. If the plot is produced in an interactive mode, we should be able to get the data. I notice the image legend gives us the interactive version at ft.com/covid-vaccine. Okay, let’s try to scrape the data from the interactive plot.
Get data address
Interactive plot will automatically fetch data from a server and then make the plot when you open a website. So if we know how the website gets the data, we can also get the data to our local drive. The simplest way is to inspect the webpage. How to do it? Move your mouse to any area within the interactive plot and then right click, you will see an “Inspect” button. I am not sure of other browsers, but Google Chrome, Microsoft Edge and Mozilla Firefox should have the function. If you don’t see it, try to download one of the three browsers.
I am using Chrome and the following steps may be slightly different for other browsers. When you click Inspect, you will see the following which shows the Element tab, containing the source code of the page using the HTML language. Note that the Inspect function is to enable anyone to view and edit a website’s source code, including its HTML, CSS, JavaScript, data, and media files.
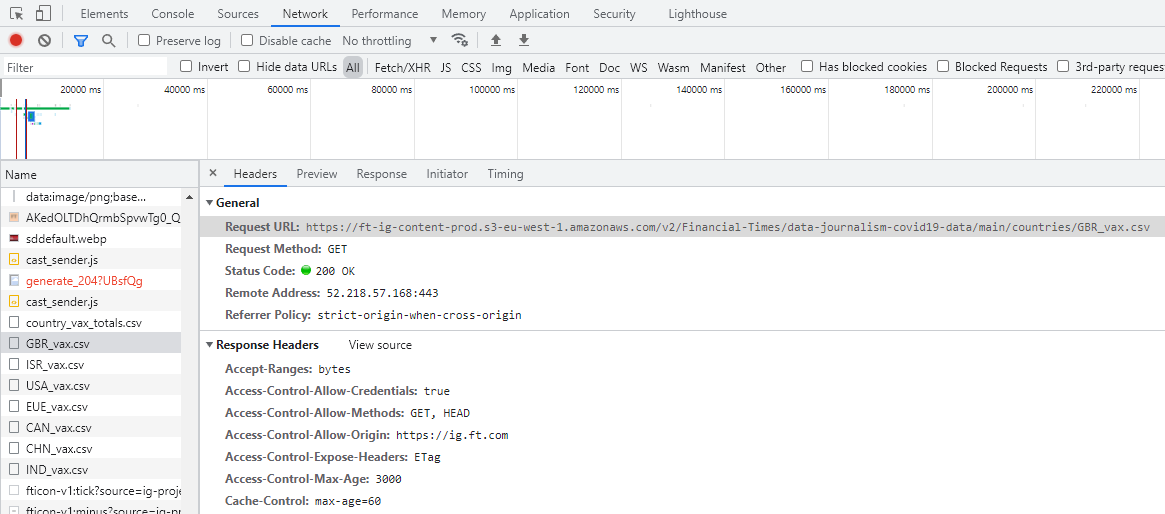
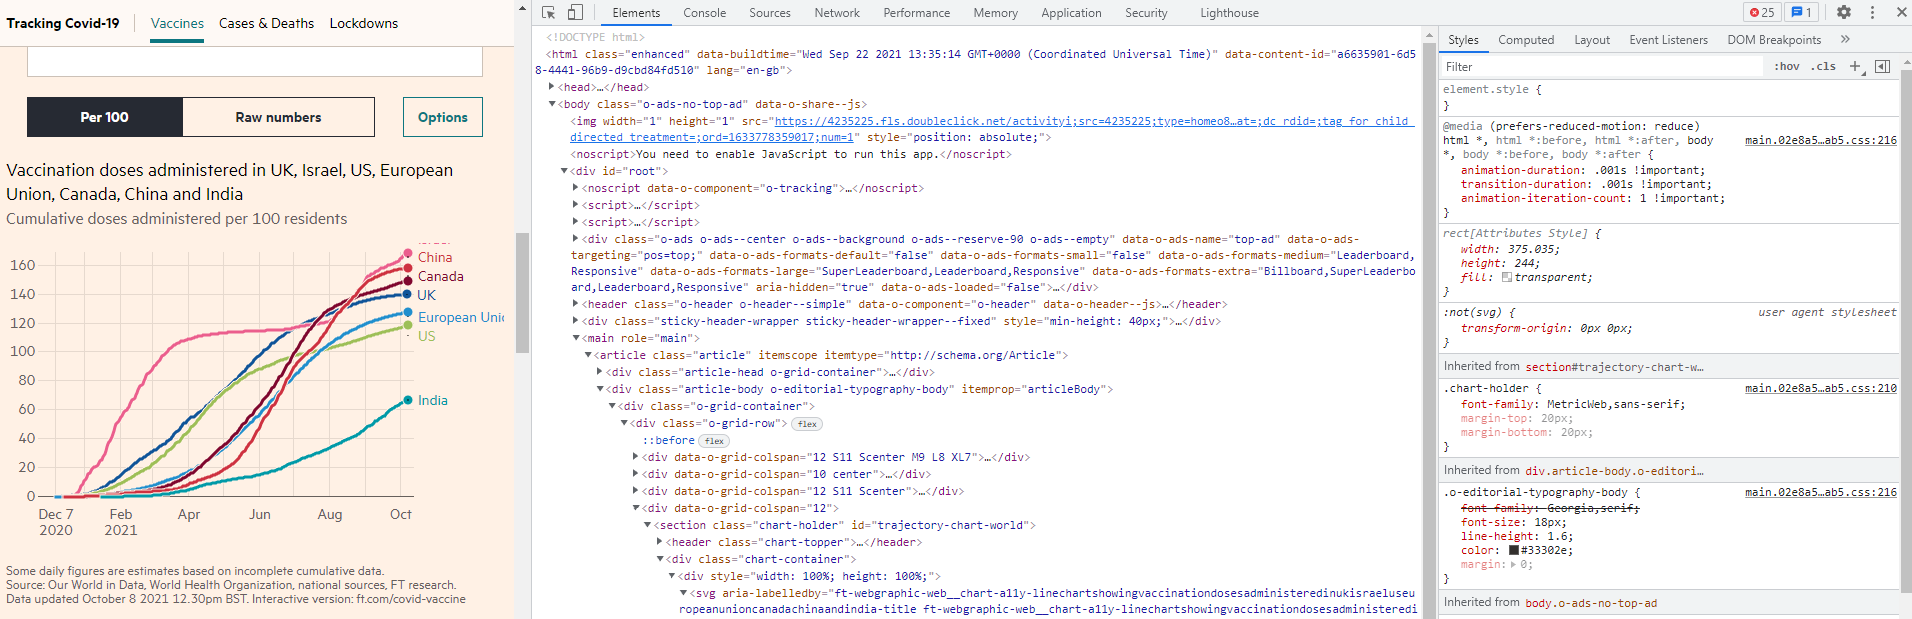 The HTML source code is very useful if you want to scrape information from the website. For this example, I don’t need it as I only need to get the interactive plot data. Now click the Network tab. This tab will show how the webpage is loaded. When you first click it, it should be blank. Refresh the FT webpage, then you will see a lot of items. Scroll down the Network page and pay attention to the Type column. You will notice some keywords like fetch and this is to fetch data from cloud to show on your screen. And there are “.csv” files!!! We are lucky as this is much easier for us to download the data than other format such as JSON file format.
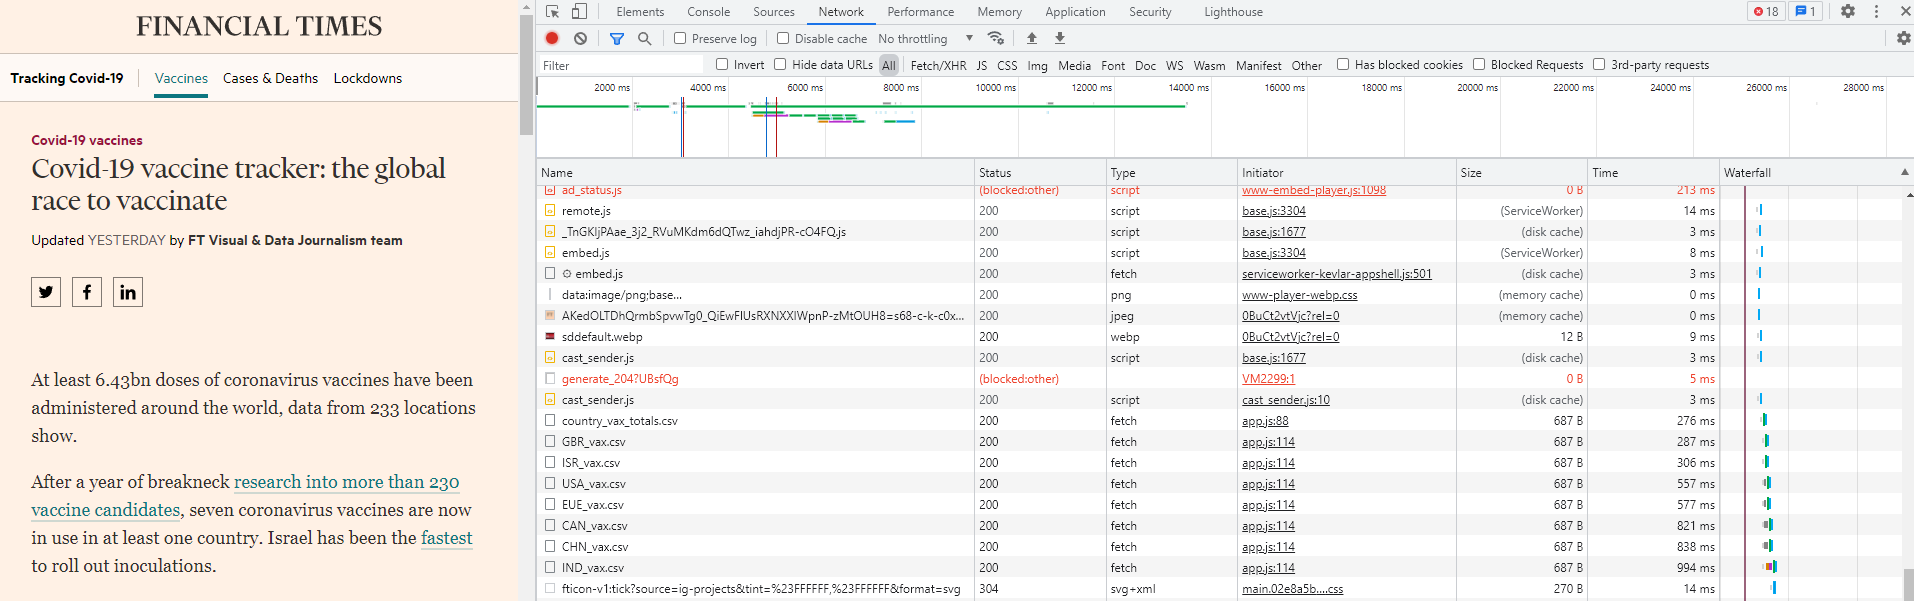
Now click one of the CSV files and it will pop up another window in which the first line contains the Request URL. This is the address of the data. You can double click the CSV file link and it is automatically downloaded!!! This means that we can use the URL to directly download the data files.
We also notice that there are other CSV files and each starts with a three-character prefix. Actually this is the abbreviation of countries. So it seems FT.com stored all the COVID-19 vaccine data by countries. If you just want to use the seven countries as shown, just download all directly. Here I am trying to download all countries’ data.
Scrape country code from tables on website
From the information we presented above, we can tell that all the data should be stored under the following address: https://ft-ig-content-prod.s3-eu-west-1.amazonaws.com/v2/Financial-Times/data-journalism-covid19-data/main/countries/. If you click it, it will show AccessDenied error message. This is normal as it is the basic cybersecurity setting of any website, disallowing visitors to view files under a directory.
Then what to do? If we can get a list of all countries’ 3-character codes, we can download them one by one using a loop. Let’s try.
I guess FT.com uses international standard country code which is available on wikipedia: country code. Let’s scrape all the country code and then try to download the FT.com COVID data.
We do almost the same thing: go to the wikipedia: country code, scroll down to the beginning of the table, right click and then Inspect.
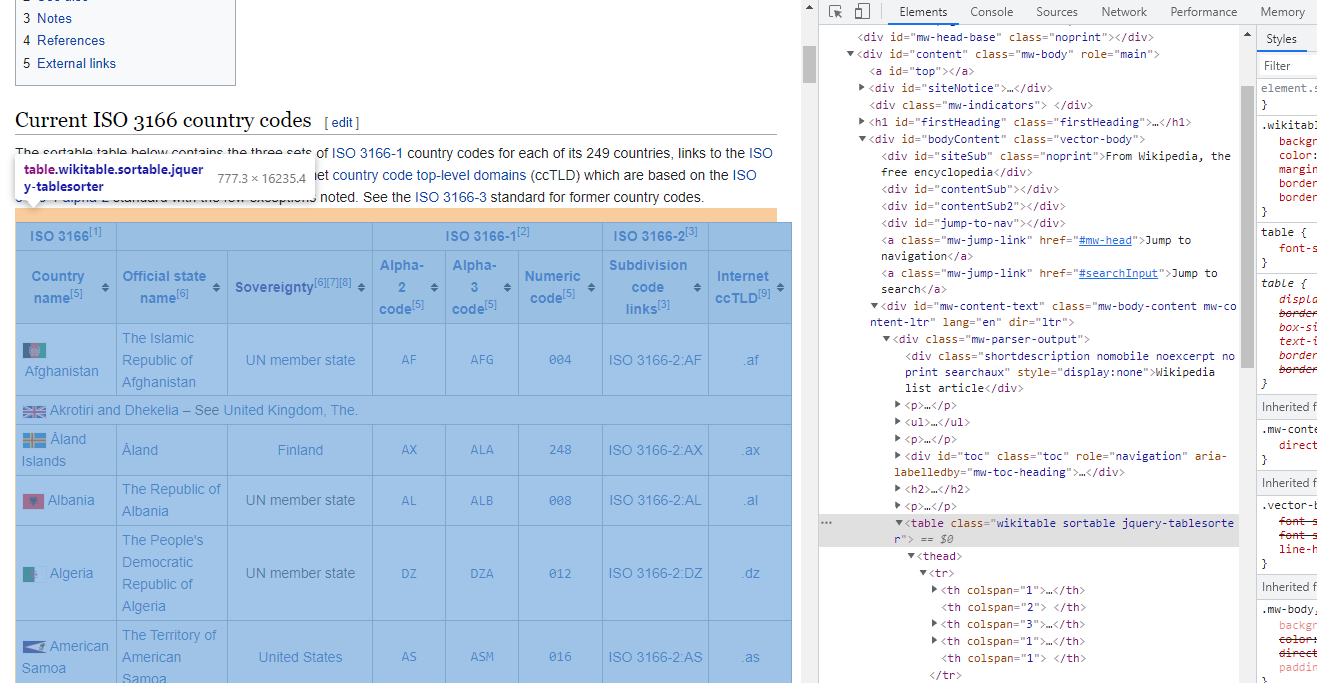
You will see a table tab in the HTML source code. This is where the table data locates. As the format of HTML table is very standard, it is very easy to scrape the table data using R, Python or any other language which provides the function. R has a package:rvest which is also part of the package:tidyverse. Do note that if you installed tidyverse, rvest is already installed. However, you need to separately launch it because library(tidyverse) only launches some core packages such as dplyr and ggplot2 (see here). Python has the Beautiful Soup library. Let’s try both of them.
The following is the R code to scrape the table.
library(tidyverse)
# Need to launch it although it is part of tidyverse
library(rvest)

# Read the HTML using read_html() from rvest
content <- read_html("https://en.wikipedia.org/wiki/List_of_ISO_3166_country_codes")

# Search for "table" tab and then convert all data into a data frame
table <- content %>%
  html_element("table") %>%
  html_table()

# Some manipulation of the data frame
table_code <- table[-1, ] %>%
  setNames(c("country_name", "country_name_full", "sovereignty", "code_alpha_2",
             "code_alpha_3", "code_numeric", "code_subdivision", "code_internet")) %>%
  mutate(code_alpha_3 = ifelse(nchar(code_alpha_3) == 3, code_alpha_3, NA)) %>%
  filter(!is.na(code_alpha_3))

head(table_code[, c("country_name", "code_alpha_3")])
## # A tibble: 6 x 2
##   country_name   code_alpha_3
##   <chr>          <chr>
## 1 Afghanistan    AFG
## 2 Åland Islands  ALA
## 3 Albania        ALB
## 4 Algeria        DZA
## 5 American Samoa ASM
## 6 Andorra        AND
Before I try the Python method, I need to setup the environment for RMarkdown to run both R and Python. The package:reticulate can do this perfectly. So we are doing Rython now.
# install the reticulate package directly
# install.packages("reticulate")

# launch the package
library(reticulate)

# specify the Python version to use
# https://rstudio.github.io/reticulate/articles/versions.html
# I assume you use the Anaconda which is easier to manage
use_python("C:\\ProgramData\\Anaconda3\\")
The following is the Python code to scrape a table from the website. To understand it, you need to understand some basic knowledge of HTML table tags.
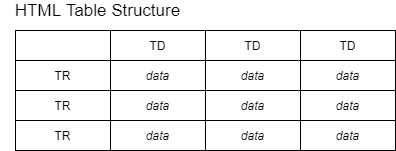
The above image show that each HTML table row (TR) has one or more table data (TD). This means that we can iterate over each row, then extract each column data.
# importing the libraries
from bs4 import BeautifulSoup
import requests
import pandas as pd

url = "https://en.wikipedia.org/wiki/List_of_ISO_3166_country_codes"

# Make a GET request to fetch the raw HTML content
content = requests.get(url).text

# Parse the html content to make the soup object
soup = BeautifulSoup(content, "html.parser")

# There may be multiple tables
# from Inspect we can tell the class of the table we want
# which is "wikitable sortable"
# You may also use the following code to Verify tables and their classes

print('Classes of each table:')
## Classes of each table:
for table in soup.find_all('table'):
    print(table.get('class'))

# Creating list with all tables
# No need for this example though as we can get the table directly
# by specifyig the class of table
## ['wikitable', 'sortable']
## ['nowraplinks', 'hlist', 'mw-collapsible', 'autocollapse', 'navbox-inner']
## ['nowraplinks', 'navbox-subgroup']
## ['nowraplinks', 'mw-collapsible', 'autocollapse', 'navbox-inner']
## ['nowraplinks', 'navbox-subgroup']
tables = soup.find_all('table')

#  Looking for the table with the classes 'wikitable' and 'sortable'
table = soup.find('table', class_='wikitable sortable')

# Defining of the data frame
df = pd.DataFrame(columns = ["country_name", "country_name_full", "sovereignty",
"code_alpha_2", "code_alpha_3", "code_numeric", "code_subdivision", "code_internet"])

# Collecting data
# the idea is to loop each row/tr and each col/td
# then store the data cell by cell
# finally append all into a data frame
for row in table.tbody.find_all('tr'):
  # Find all data for each column
  columns = row.find_all('td')

  if(len(columns) == 8):
    country_name = columns[0].text.strip()
    country_name_full = columns[1].text.strip()
    sovereignty = columns[2].text.strip()
    code_alpha_2 = columns[3].text.strip()
    code_alpha_3 = columns[4].text.strip()
    code_numeric = columns[5].text.strip()
    code_subdivision = columns[6].text.strip()
    code_internet = columns[7].text.strip()

    df = df.append({'country_name': country_name,
    'country_name_full': country_name_full,
    'sovereignty': sovereignty, 'code_alpha_2': code_alpha_2,
    'code_alpha_3': code_alpha_3, 'code_numeric': code_numeric,
    'code_subdivision': code_subdivision, 'code_internet': code_internet},
    ignore_index = True)

df[["country_name", "code_alpha_3"]].head(6)
##      country_name code_alpha_3
## 0     Afghanistan          AFG
## 1   Åland Islands          ALA
## 2         Albania          ALB
## 3         Algeria          DZA
## 4  American Samoa          ASM
## 5         Andorra          AND
So which method is better, R or Python? For such as simple table, I find the package:rvest is much more efficient and simpler than Python’s Beautiful Soup package. Maybe there are simpler methods in Python. Let me know please.
Scrape COVID-19 vaccine data by country
Now we have all the 3-character country code, we are ready to download all the files from FT.com.
The algorithm is similar to importing multiple files using R. Instead of binding columns, we bind rows for this data. Of course all the data should have the same structure though.
We will also require a new package:httr which can execute HTTP verbs such as GET and POST for communication with the website.
The following code will take about 2 to 3 minutes, depending on your computer speed.
# this lib is to read HTTP address
library(httr)

url1 <- "https://ft-ig-content-prod.s3-eu-west-1.amazonaws.com/v2/Financial-Times/data-journalism-covid19-data/main/countries/"

for (code in table_code$code_alpha_3) {

  # Create the first data if no data exist yet
  if (!exists("vax_data")) {
    vax_data <- content(GET(paste0(url1, code, "_vax.csv")))
    if (!is.data.frame(vax_data)) {
      rm(vax_data)
    }
  }

  # if data already exist, then merge with existing data
  else {
    tempory <- content(GET(paste0(url1, code, "_vax.csv")))
    if (!is.data.frame(tempory)) {
      rm(tempory)
    }
    else {
      vax_data <- vax_data %>% bind_rows(tempory)
      rm(tempory)
    }
  }
}
Plot COVID-19 vaccine data by country
We use the package:plotly to produce interactive plot. It is a very powerful tool and the following is just a very simple try.
library(plotly)

plot <- vax_data %>%
  group_by(code) %>%
  plot_ly(x = ~date, y = ~total_doses_per_100) %>%
  add_lines(alpha = 0.1, name = "Other Countries",
            visible = "legendonly")

plot %>%
  add_fun(function(plot) {
    plot %>% filter(code == "SGP") %>%
      add_lines(name = "Singapore")
}) %>%

  add_fun(function(plot) {
    plot %>% filter(code == "CHN") %>%
      add_lines(name = "China Mainland")
  }) %>%

  add_fun(function(plot) {
    plot %>% filter(code == "GBR") %>%
      add_lines(name = "United Kindom")
  }) %>%

  add_fun(function(plot) {
    plot %>% filter(code == "USA") %>%
      add_lines(name = "United States")
  }) %>%

  add_fun(function(plot) {
    plot %>% filter(code == "HKG") %>%
      add_lines(name = "Hong Kong")
}) %>%

  add_fun(function(plot) {
    plot %>% filter(code == "AUS") %>%
      add_lines(name = "Australia")
}) %>%

  add_fun(function(plot) {
    plot %>% filter(code == "TWN") %>%
      add_lines(name = "Taiwan")
}) %>%

  layout(
    title = "Cumulative vaccination doses administered per 100 residents",
    xaxis = list(title = ""),
    yaxis = list(title = ""),
    hovermode = "x unified"
)
Done! Although the plot is not exactly the same, it is too time consuming to reproduce 100%.
Hope you find this post interesting and useful. Since you are already here, why not try to scrape the data from our course interactive plot and then reproduce it? This is a bit challenge though.
Time for a cup of tea now. Want to book my time? Click here!

Last updated on 12 October, 2021
Wang Jiwei
Associate Professor
My current research/teaching interests include digital transformation and data analytics in accounting.